A/B Testing with Cookie Cats

About the game
Cookie Cats is a colorful mobile game, where the user’s goal is to collect cookies (connect-4-style) and feed hungry cats. In this analysis, I use A/B testing to help decide at which level to place gates in the game. Gates are pauses in the game where the user must make an in-app purchase or wait a certain amount of time before progressing to the next level. Beyond providing additional revenue, these gates serve as rest time for the user, which in turn, increases and prolongs enjoyment. In this analysis, we’ll answer the questions: Shere should gates be placed in the Cookie Cats app? Should the gate be moved from level 30 to level 40?
The supporting mobile game data for this analysis was sourced from DataCamp Projects. I recommend checking out DataCamp courses and projects as an interactive way to learn Data Science.
Getting started
I was curious about the look and feel of the game, so I installed Cookie Cats and played a few rounds. I noticed there were long load times between levels and the game is definitely geared towards children. Personally, I could not imagine playing 30-40 consecutive rounds in one sitting!
After familiarizing myself with the game, I turned to the data to explore some high level features. DataCamp provides these definitions for the data fields:
userid- a unique number that identifies each player.version- whether the player was put in the control group (gate_30- a gate at level 30) or the group with the moved gate (gate_40- a gate at level 40).sum_gamerounds- the number of game rounds played by the player during the first 14 days after install.retention_1- did the player come back and play 1 day after installing?retention_7- did the player come back and play 7 days after installing?
With these definitions in mind, let’s take a look at the number of players that encountered a gate at level 30 vs those that encountered a gate at level 40:
## # A tibble: 2 x 2
##   version     n
##   <chr>   <int>
## 1 gate_30 44700
## 2 gate_40 45489
Next, let’s explore the average retention statistics by gate version:
## # A tibble: 2 x 3
##   version avg_retention_1 avg_retention_7
##   <chr>             <dbl>           <dbl>
## 1 gate_30           0.448           0.190
## 2 gate_40           0.442           0.182
From this high level summary, it looks as if both 1- and 7-day retention are slightly higher for the game version with gates at level 30. What does the distribution of game rounds look like for the level 30 and level 40 version of the game? There are a few high-round players, but we’ll limit to 100 rounds for this overview graphic:

From this graphic, we can see the overall distributions are quite similiar, although it looks like the lines diverage around the rounds we are testing. Let’s look into each retention metric in detail to see if there is a significant difference between the two.
1-Day Retention
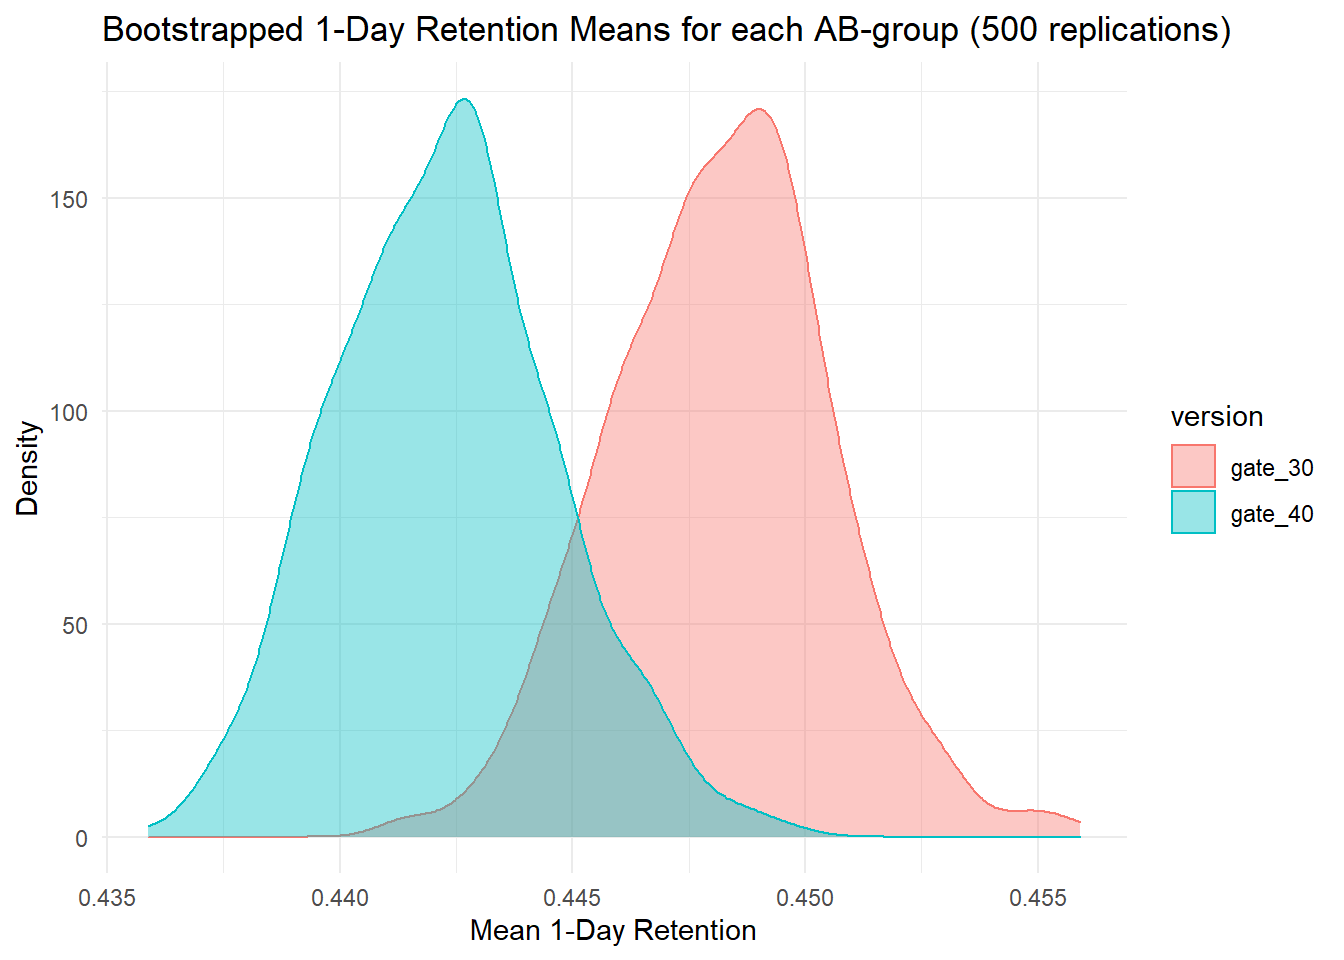
There appears to be a slight difference between the 1-day average retention with the gate at level 30 (44.8%), in comparison to the gate at level 40 (44.2%). We’ll use bootstrapping to explore this difference and to better understand uncertainty in the retention values.


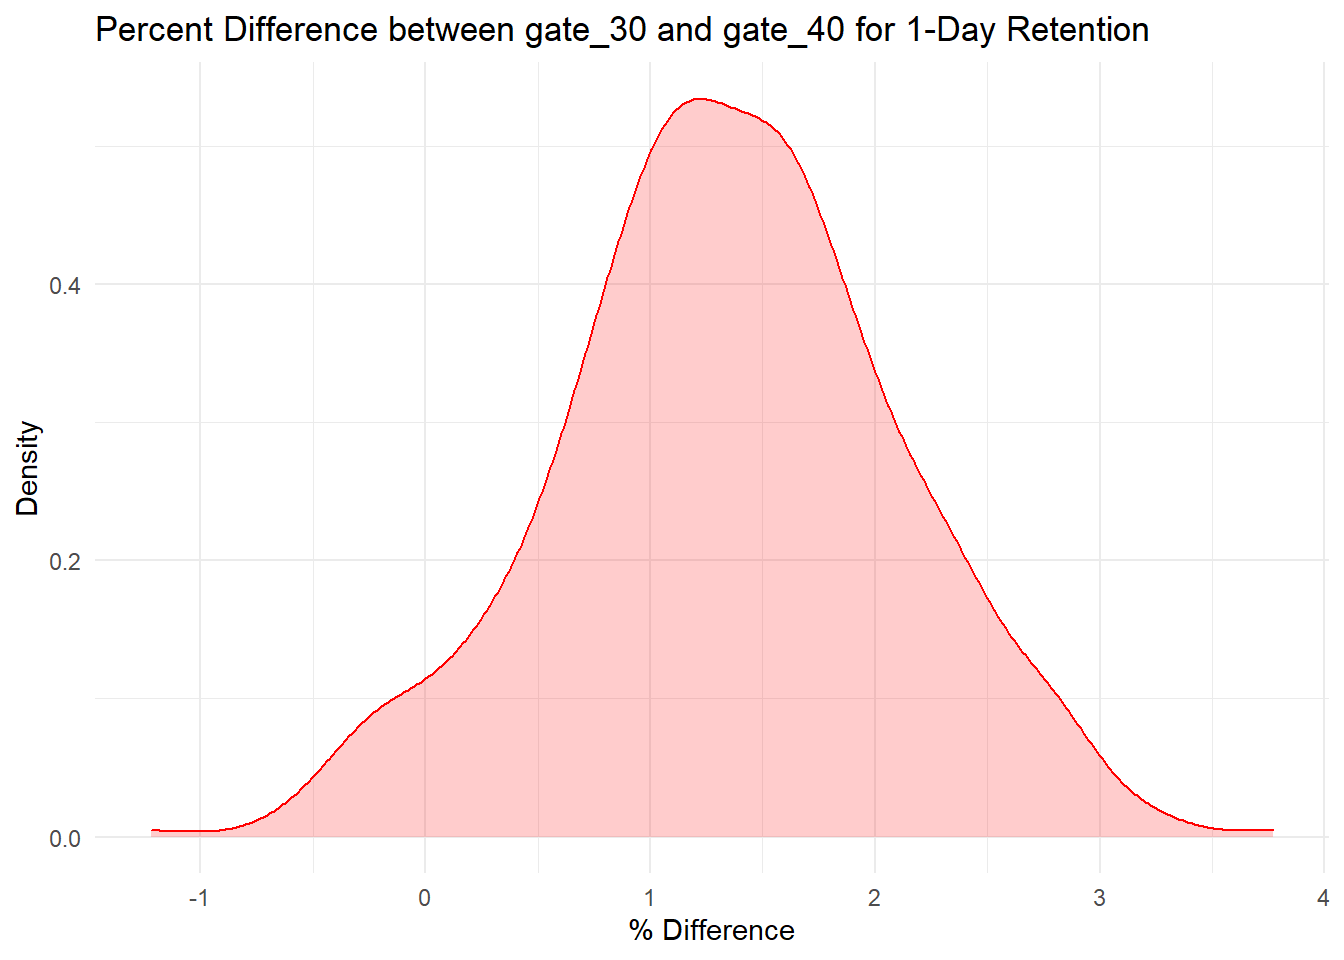
The percent difference graphic shows that the most likely percent difference is around 1-2%, indicating better performance with the gate at level 30. Let’s calculate the probability that the difference is above 0%:
## # A tibble: 1 x 1
##   gate_30_hgr
##         <dbl>
## 1        0.95
Having played a few rounds of the game, I recognize that both level 30 and level 40 would take a fairly long time to reach. With that in mind, 7-day retention may be a better metric for this particular question. Let’s explore the difference using 7-days time.
7-Day Retention
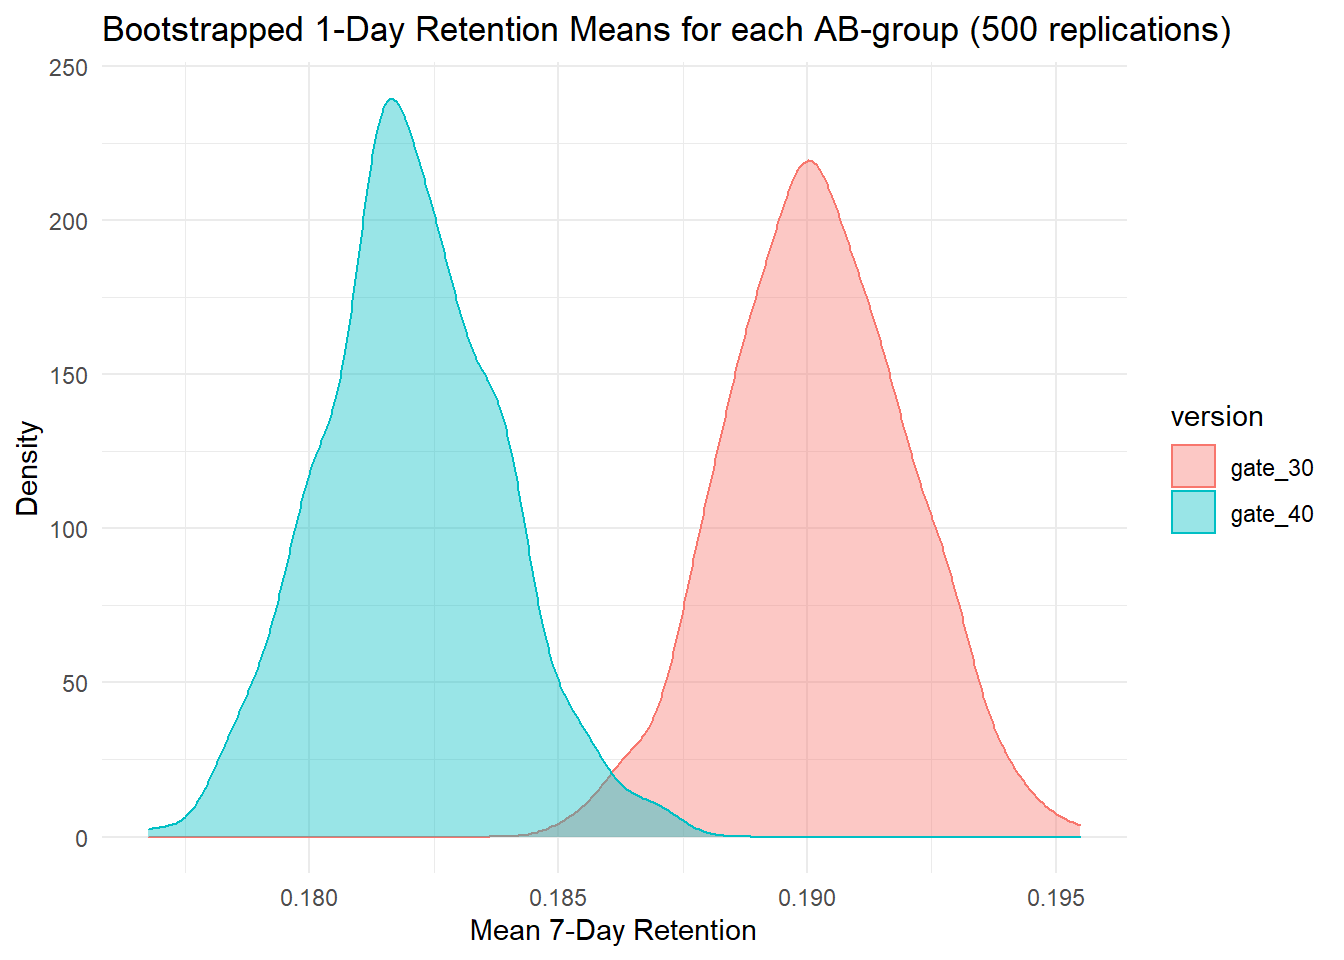
Overall, 7-day retention is lower for both versions of the game. This makes sense as fewer players will continue playing for a longer duration of time. As we saw with 1-day retention, there appears to be a slight difference between the 7-day average retention with the gate at level 30 (19.0%), in comparison to the gate at level 40 (18.2%). We’ll use bootstrapping to explore this difference and to better understand uncertainty in the retention values.


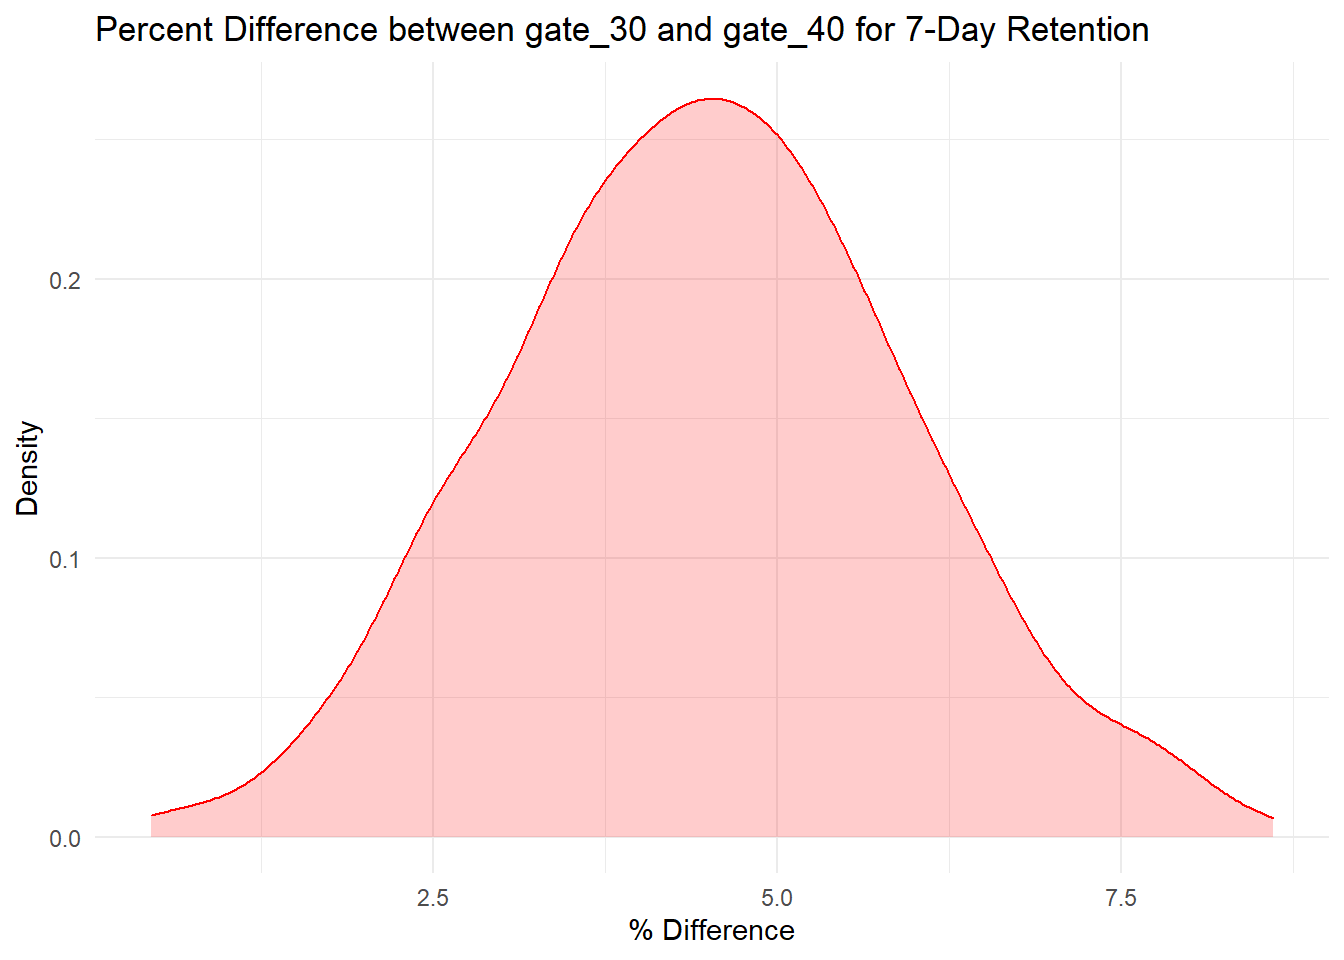
Here the percent difference graphic shows that the most likely percent difference is around 3-5%, again indicating better performance with the gate at level 30. Let’s calculate the probability that the difference is above 0%:
## # A tibble: 1 x 1
##   gate_30_hgr
##         <dbl>
## 1           1
The bootstrap result tells us that there is strong evidence that 7-day retention is higher when the gate is at level 30 than when it is at level 40. If we want to keep retention high — both 1-day and 7-day retention — we should not move the gate from level 30 to level 40. There are, of course, other metrics we could look at, like the number of game rounds played or how much in-game purchases are made by the two AB-groups, but retention is one of the most important metrics. If we don’t retain our player base, it doesn’t matter how much money they spend in-game.
While it is a bit counterintuitive that placing the gate earlier would increase retention, this result aligns with theory surrounding game play: players are more satisfied when they take breaks from a mobile game.