Seattle Cycling Trends
In this post, I revisit a bike and pedestrian traffic analysis I performed several months ago in light of the COVID-19 pandemic. The data supporting this analysis was sourced from the Seattle government transportation website and the original analysis was inspired by a R for Data Science Tidy Tuesday community event. I highly recommend checking out the Tidy Tuesday repository for fun, quick data challenges!
Seattle Bike Traffic Overview
First, let’s take a look at an overview of bike traffic over time.
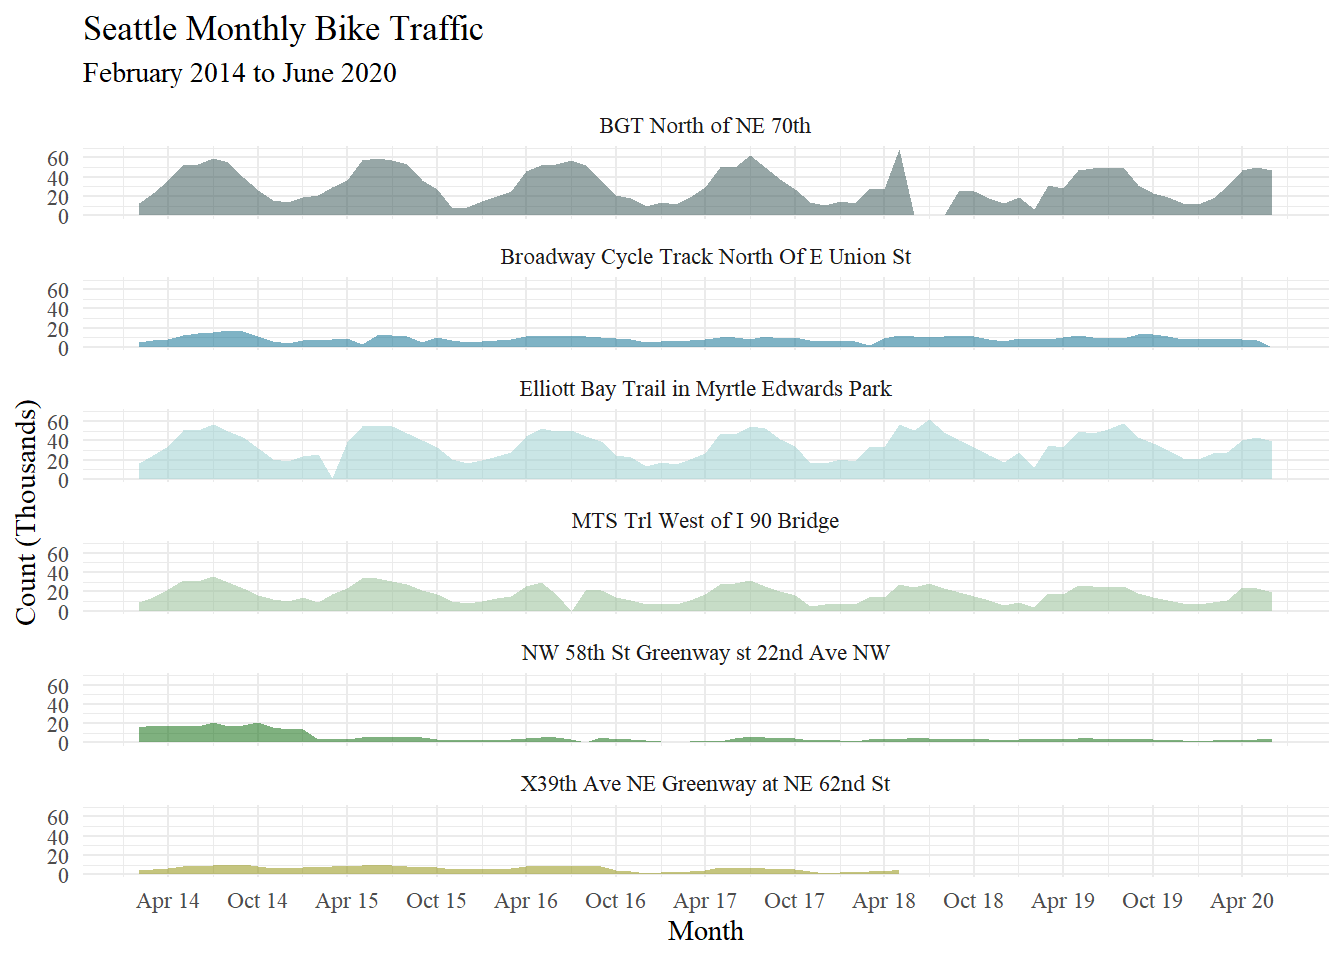
A few high-volume crossings (e.g. BGT North of NE 70th and Elliot Bay Trail) stand out, as well as some gaps in the counter data. There is also clear seasonality to this data, as expected, with rainy winters in Seattle. Using NOAA weather files for the Seattle area, we can take a quick look at the relationship between the number of bicyclists and precipitation. We consider a “rainy” day to be one with at least 0.5 inches of precipitation.
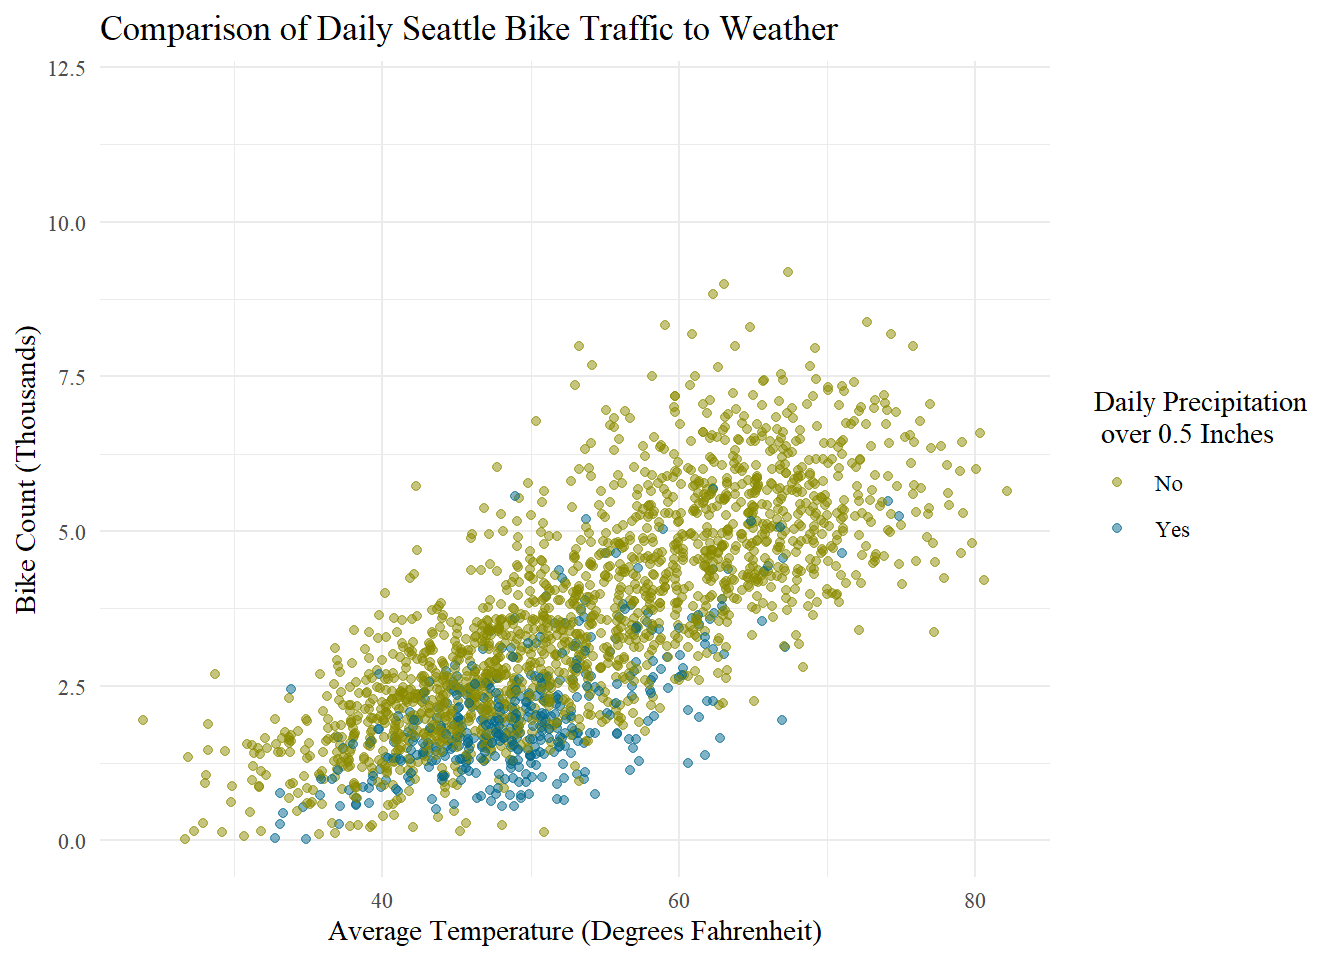
We can see a relationship between temperature and bike count, as well as a relationship between preciptiation and bike count. Bicyclist counts are noticeably higher on sunny, dry days than cold wet ones. In Seattle, rainy day bicyclists are likely regular commuters.
Next, let’s look into the hourly bike traffic patterns at different crossings to get a sense of their uses.
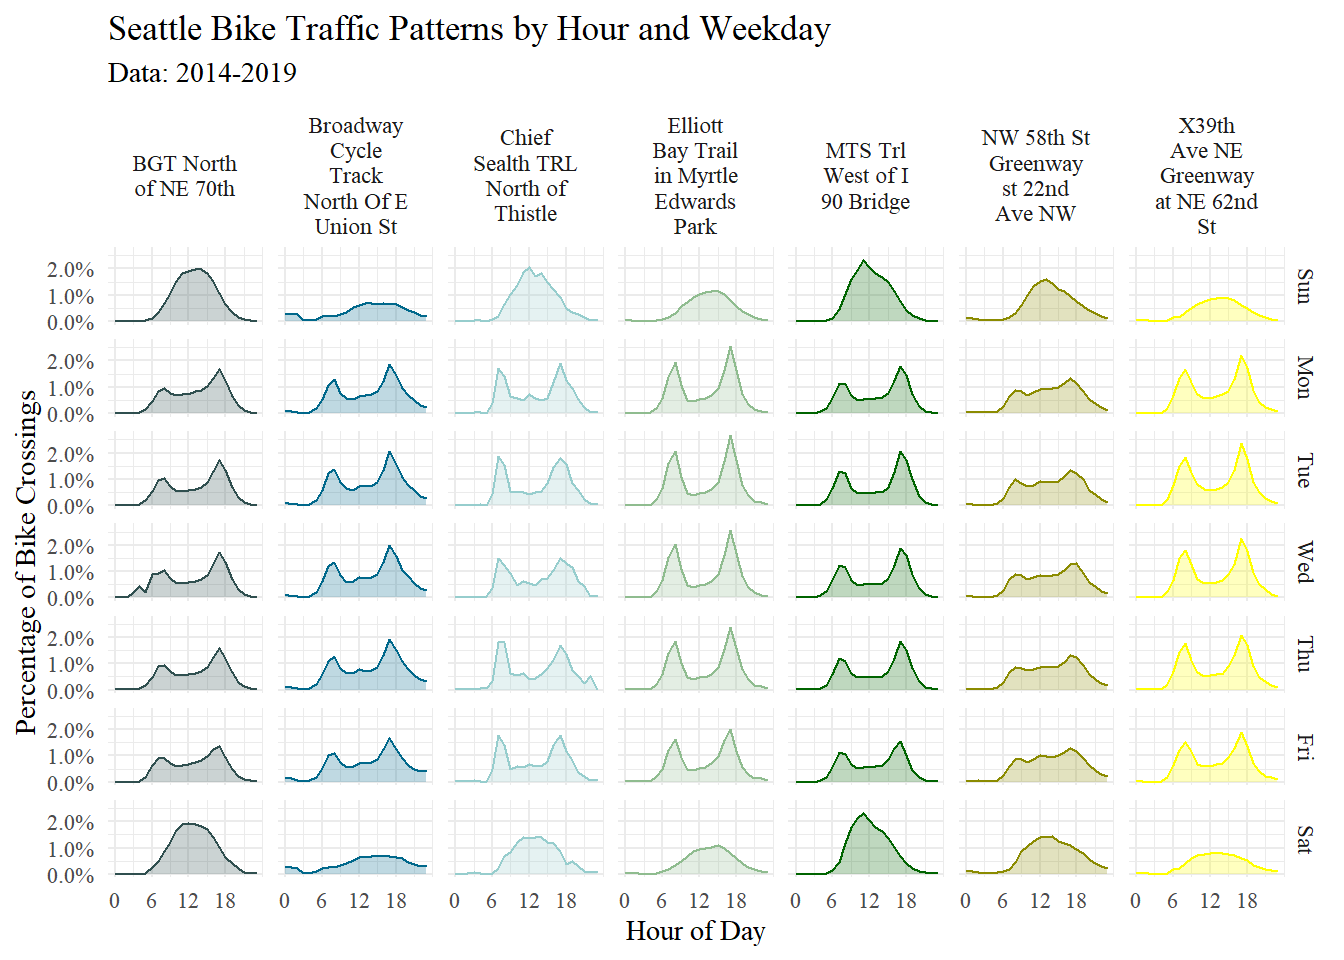
Many bike crossing show clear commuter patterns on the weekdays, with ridership hitting its highest counts around 9 am and 5 pm on Monday - Friday. For most crossings, weekend traffic peaks around noon.
COVID-19 and Bike Traffic
Seattle was the first major US city to be hit by COVID-19 starting in February 2020. How have social distancing practices impacted overall transportation trends over the last three months?
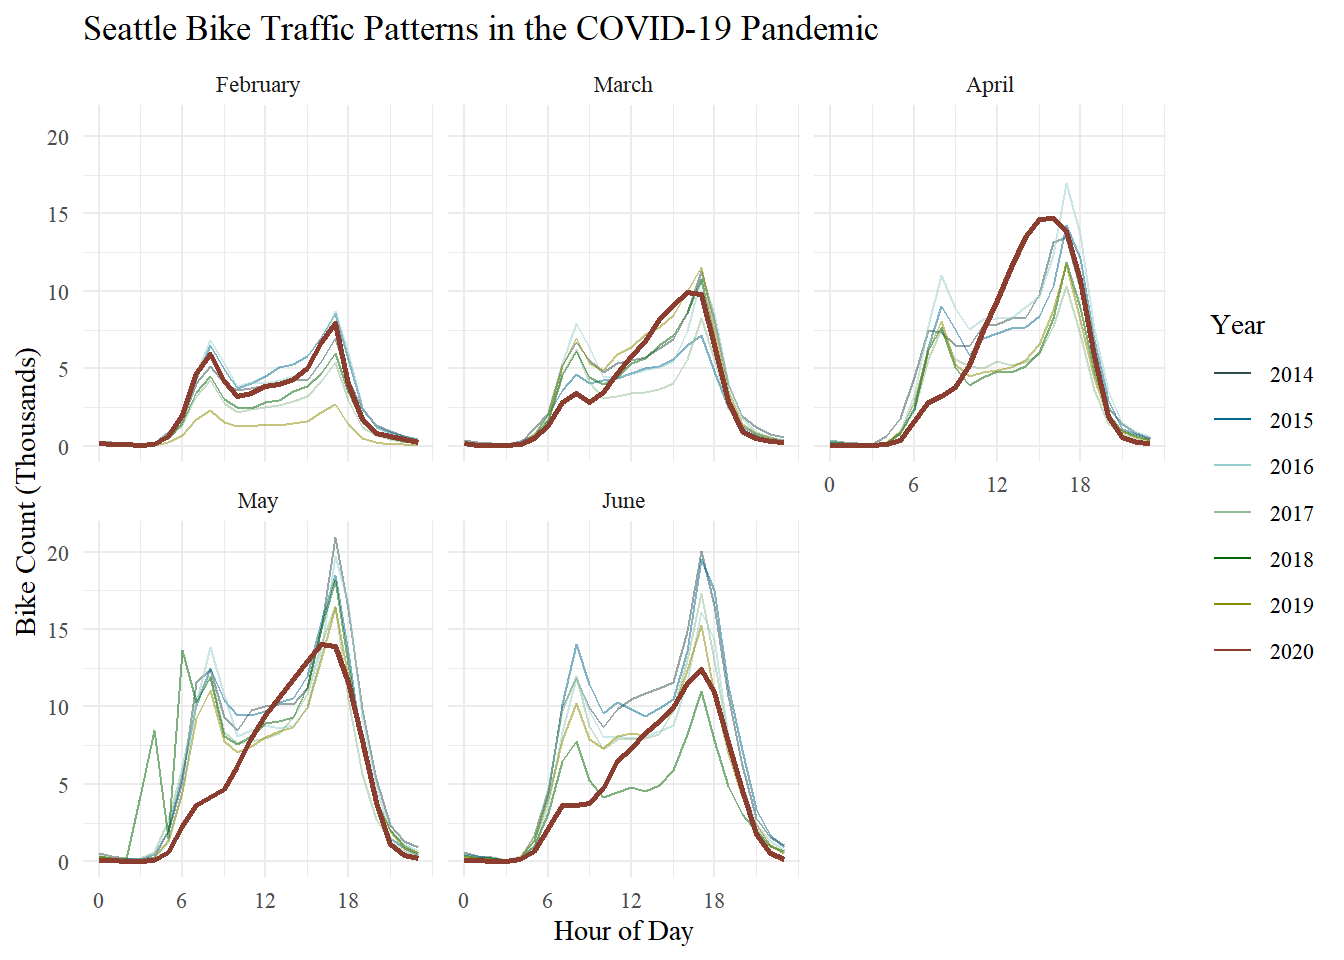
As the pandemic worsens, we see a loss of commuting structure to the bicyclists’ movement over the hours of the day. By April, overall bike count has increased significantly from previous years, with counts peaking in the afternoon. Finally, let’s look at these patterns broken out by lane for the month of April, in comparison with average April ridership from 2014-2019.
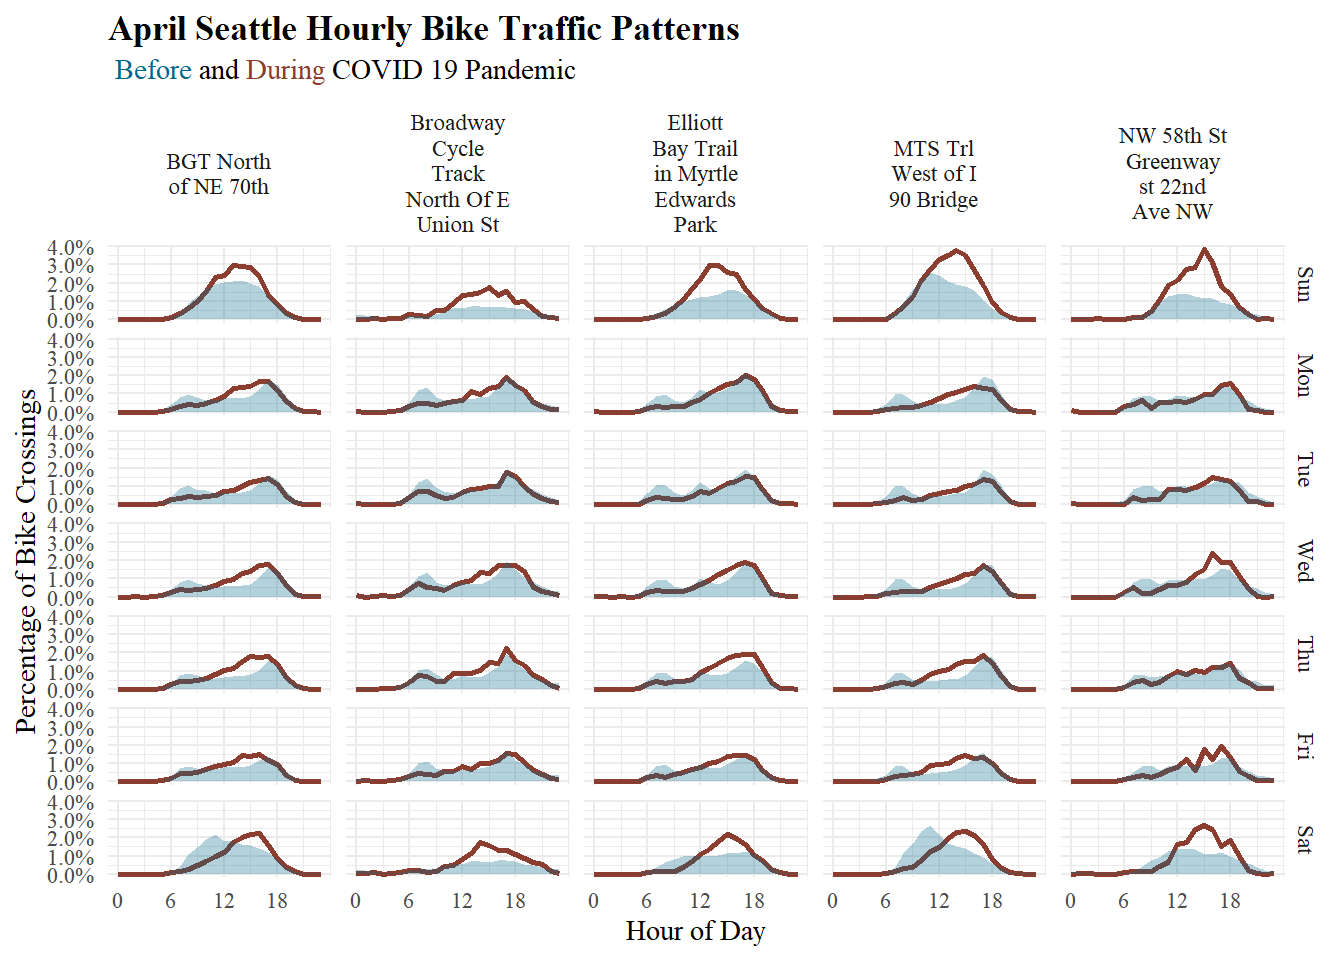
These quick snapshots of Seattle’s bike lanes show a changing picture of transportation in the midst of a pandemic. As social distancing practices make public transit or ride-hailing less recommended modes of transportation, many turn to biking for both necessary transportation and leisure.